







Top-Top Info Worldwide is a popular online newsportal and going source for technical and digital content for its influential audience around the globe.


Joe Davis emerged as the bedrock of competitive snooker, clinching an unprecedented 15 consecutive World Snooker Championship titles from 1927 to 1946. His legacy as a pioneer and unparalleled dominance set the stage for future generations.

Hungarian chess grandmaster Judit Polgár was born on 23 July 1976 and is the strongest female chess player in the history of chess. He achieved the title of Grandmaster at the age of just 15 years and 4 months in 1991.
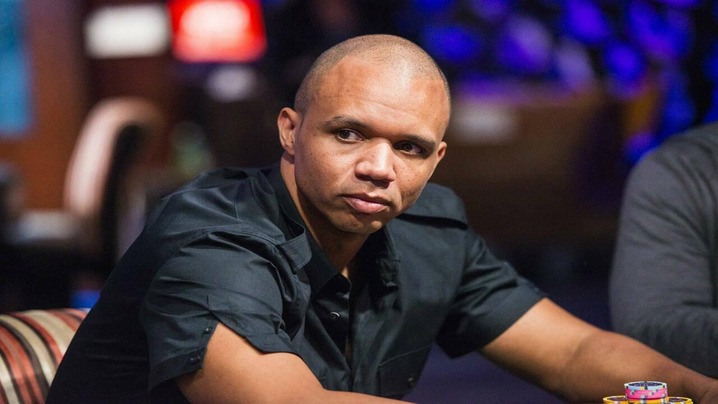
Calling one person the greatest poker player is tempting, but poker does not offer a single, complete scoreboard. Tournament winnings are public, while many high-stakes cash-game results remain private. A player can specialize in no-limit hold’em, mixed games, heads-up play, tournaments, or cash games, and excellence in one format does not automatically transfer to another. Even published earnings require context: they measure money cashed, not buy-ins paid, travel costs, backing arrangements, or losses.
A useful comparison therefore starts with criteria rather than a countdown. The World Series of Poker’s Hall of Fame standards provide a strong framework: performance against acknowledged top competition, high stakes, consistent excellence, peer respect, and the ability to stand the test of time. Those standards also recognize non-players who made lasting contributions to the game.
No single metric captures all five. Bracelets reward success at the WSOP, but the number and size of events have changed substantially over time. Main Event titles carry historical weight, yet one tournament contains enormous short-term variance. Career cashes favor the modern era, when there are more events, larger fields, high-roller schedules, and frequent re-entry opportunities.
Instead of fixing an eternal top ten, it is more accurate to group candidates by the evidence supporting them. Johnny Moss and Doyle Brunson connect modern poker to its high-stakes road-gambler era and early WSOP history. Stu Ungar’s tournament peak remains extraordinary, including three WSOP Main Event victories. Phil Hellmuth’s record is defined by exceptional WSOP longevity and bracelet production. Phil Ivey is frequently associated with elite mixed-game ability and success across tournament and cash formats. Daniel Negreanu combines major results, long-term relevance, and unusual public influence.
Other cases illuminate why categories matter. Erik Seidel has remained competitive across several generations and tournament ecosystems. Johnny Chan paired back-to-back Main Event victories with a long high-stakes career. Jennifer Harman earned particular respect in mixed cash games, an area poorly represented by public databases. Chris Moneymaker’s 2003 Main Event victory cannot be judged only by lifetime titles because its cultural effect helped introduce a huge new audience to online qualification and televised poker.
These examples are not a definitive ballot. They show that a credible list must declare what it values. A ranking centered on tournament records will differ from one based on mixed-game mastery, cash-game reputation, or historical influence.
Choose a time frame, identify eligible formats, and assign weights before looking at names. Separate results from reputation and influence. Adjust raw winnings for the tournament environment, and avoid treating incomplete cash-game stories as audited facts. Finally, publish uncertainty: close scores should produce tiers, not false precision.
Poker greatness is best understood as a multidimensional argument supported by records and informed peer judgment. A transparent method will not end debate, but it makes the debate more honest—and much more useful than presenting personal preference as settled fact.
Sources: WSOP Poker Hall of Fame; WSOP Hall of Fame criteria; WSOP player records; Poker Hall of Fame member directory.

Gunther VI is the richest pet in the world. When talking about wealth, this animal is the richest in the animal kingdom. Aside from being the richest pet in the world, he also has a net worth of around $500 million.

A list of the “most valuable car companies” can be accurate for a moment and outdated by the next trading session. Share prices move, exchange rates change, and companies report on different fiscal calendars. More importantly, market capitalization is not the same as revenue, profit, vehicle sales, brand value, or the value of everything a company owns. Understanding the ranking requires understanding the metric.
For a publicly traded automaker, market capitalization equals the current share price multiplied by shares outstanding. It represents the market’s aggregate price for the company’s equity at that time. It does not include privately held manufacturers in a directly comparable way, and it can be affected by different share classes, cross-holdings, or major subsidiaries.
Enterprise value is another measure. It adjusts equity value for debt and cash, making it useful when comparing capital structures. Accountants provide still other measures, including assets and shareholders’ equity. None is automatically the “correct” answer; each addresses a different question.
Toyota and Volkswagen demonstrate the scale of established global manufacturing. Toyota’s 2025 integrated report lists more than nine million consolidated vehicle sales for its fiscal year, while Volkswagen’s 2025 annual report reports about nine million customer deliveries. Scale can support purchasing power, broad distribution, parts revenue, and resilience across markets.
Yet investors price expected future cash flows, not trophies for the most units sold. A company with lower current volume can command a higher market capitalization if investors expect faster growth, stronger margins, valuable software, battery expertise, charging assets, autonomous-driving potential, or expansion into energy services. The reverse is also true: large sales do not guarantee a high valuation when a manufacturer has thin margins, heavy debt, excess capacity, legal exposure, or a costly technology transition.
Start by fixing a date and currency. State whether the figure is market capitalization, enterprise value, revenue, or brand valuation. Use audited filings for financial results and explain differences in fiscal periods. Separate an automaker’s vehicle business from financing, insurance, energy, or other divisions where possible. Finally, avoid treating a high share price as proof of better cars; product quality and investment expectations are related only indirectly.
For readers, the best “top ten” is therefore a dashboard rather than a single ladder. One column might show market capitalization, another annual revenue, another operating margin, and another deliveries. The order will change from column to column, revealing the real story: automotive leadership can mean scale, profitability, innovation, durability, or investor confidence, and no one number captures all five.
That multidimensional view also explains why leadership can shift during a technology transition even when factory output changes slowly.
Sources: U.S. SEC EDGAR company filings; Tesla Investor Relations; Toyota integrated reports; Toyota SEC filings; Volkswagen Group Annual Report 2025.
Top-Top Info Worldwide is a popular online newsportal and going source for technical and digital content for its influential audience around the globe.